

Marriage and Age Differences
| Tweet |
|
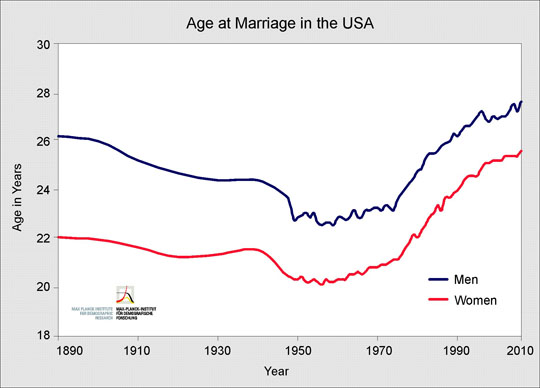
The Max Planck Institute for Demographic Research produced an interesting study on marriage, life expectancy and age differences. An analysis of the study provides a useful genealogy brick wall solution. The study is interesting in itself (the study proves that men live longer if they have a younger wife, whereas women are best off if they marry someone the same age). However, what caught our eye was the graph showing the average age of marriage in the United States.
The graph reproduced below covers the period from 1890 to 2010 and shows the minimum marriage age was reached in the early 1950s. Most people probably would have thought that people married younger around the turn of the century. Clearly, the Second World War had a major influence on the average marriage age.
This graph also indicates a neat genealogy brick wall solution by providing a reference for genealogists wanting to estimate the birth date of one spouse knowing the birth date of the other spouse and the year in which they were married. The typical age differences are summarized in the following handy table.
| Year of Marriage | Typical Age Difference |
|---|---|
1890 to 1920 |
4.0 year |
1920 to 1940 |
3.0 year |
1940 to 1970 |
2.0 year |
1970 to 1980 |
1.5 year |
1980 to present |
1.0 year |
For example, if you were trying to track the birthdate of a wife given that the husband was born in 1893 and the couple was married in 1918, then a good estimate would be that the wife was born four years after the husband in 1897.
You Might Also Like:
Why Immigrants Change Their Name